 Tradingview
Tradingview crypto screener uses volume filters to narrow coin and pair shortlists
Tradingview crypto screener narrows coin and trading-pair lists using volume filters, price performance and technical indicators. Choose Crypto Coins for an asset-level shortlist, CEX for centralized-exchange pairs or DEX for decentralized-exchange pools. These screens measure different objects, so their volume figures answer different questions. Build the list around the market you need, keep each metric's unit and period visible and inspect shortlisted symbols before moving into chart analysis.
Volume periods and units
Dollar turnover
A volume filter becomes meaningful when its measurement period and unit match the activity that you want to compare. A 24-hour figure covers trading within that window. A field labeled Volume 24h in USD expresses turnover in US dollars. It does not represent the number of tokens currently available for sale. A percentage-change field describes how turnover changed, which differs from the turnover amount itself.
Volume records trading activity. Order-book depth on a centralized venue and available liquidity in a decentralized pool address different questions about execution. A large turnover figure alone does not establish how much a particular order would move the price.
Activity relative to recent history
CEX Relative Volume divides USD-converted volume for the current bar by the average of the preceding 10 bars. The average excludes the current bar. A ratio above one means activity exceeds that baseline; it does not establish the direction of price movement. This calculation uses the chosen interval, so changing candle length changes the activity that the ratio compares.
Applying filters and checking matching rows
Market boundaries
The screener choice establishes the initial universe before any volume condition narrows it. Open Products, choose Screeners and select Crypto coins, CEX pairs or DEX pairs. In CEX, the Exchange, Quote currency and Symbol type filters define the venue, quotation asset and instrument category. The quote currency is the second asset in a pair. Spot pairs, futures and perpetual contracts remain distinct categories.
Membership and sorting
Active filters determine which rows qualify, while sorting determines their order. A descending volume sort does not apply a minimum-volume condition. Add the volume filter when the shortlist needs that boundary, then use its available condition controls. Some filters provide presets; others also allow manual setup. Combining conditions requires matching symbols to satisfy every active filter.
Visible measurement fields
A displayed column helps explain the selection when it uses the same metric and parameters as its filter, while the exchange and symbol type fields keep the CEX market identity beside its volume. For DEX rows, retain the network, exchange and liquidity fields that identify the pool context. Column headers and settings establish which measurement the table actually displays.
How do technical indicator intervals affect a shortlist?
Technical indicator intervals determine the candles used in each calculation, so the same market can qualify differently across intervals. Timeframe-sensitive screener filters and columns have their own interval settings. Configure these in the filter dialog and column settings. If a filter uses one interval while its visible column uses another, the row can appear inconsistent even when both calculations are correct, because they describe different sets of candles for the same instrument. Several columns can display the same measurement over different intervals, making the time horizon explicit in comparisons.
RSI, the Relative Strength Index, measures price momentum. Simple moving averages (SMA) and exponential moving averages (EMA) provide other technical filtering choices. These conditions add a price-based reason for including a market alongside its trading activity. Where the indicator offers adjustable parameters, preserve the same settings during chart inspection. An indicator condition describes its calculation; a volume threshold describes turnover or activity relative to a baseline.
Watchlist handoff and chart inspection
A watchlist carries selected instruments into continued analysis after screening. The context-menu command Add Selected Symbols To Watchlist transfers selected results. Flagging a symbol also adds it to its flagged list.
The receiving watchlist should contain the intended market symbols, including their exchange identity where applicable. Matching only the base asset name leaves room for a different quote currency or instrument type. Retaining a symbol also does not preserve the volume value that originally qualified it.
Chart inspection uses the specific symbol and interval relevant to the screening condition. A screener chart grid provides a compact visual view, while Supercharts supports deeper chart analysis. The date range in the screener's Chart view determines its displayed candle interval. Keep that display choice separate from a filter's calculation interval.
Price alerts monitor a selected symbol after chart analysis. Screening identifies candidates across a universe; an alert monitors its configured condition. Adding a candidate to a watchlist creates neither an alert nor a trading order.
Does auto-refresh keep a volume shortlist fixed?
Auto-refresh updates the displayed data, so symbols can enter or leave a volume-filtered shortlist as their values and other conditions change. Its refresh setting controls table updates. The volume window controls what the field measures; an indicator interval controls its calculation candles. Increasing the refresh frequency does not shorten a 24-hour volume window.
A selected symbol can remain in a watchlist after its market data stops meeting the original filter. The saved symbol identifies the candidate; the refreshed screen establishes whether it qualifies now. Revisit the measured field before using an earlier shortlist as a description of present activity.
Crypto Coins, CEX and DEX shortlist choices
The object represented by each row determines which screener fits a volume-based shortlist. The Crypto Coins Screener calculates coin prices from average values across supported exchanges. CEX and DEX screens retain the market context needed for pair-level analysis. Their additional fields help distinguish instruments or pools that share an underlying asset.
| Screen | What a row represents | Useful shortlist fields | Comparison error to avoid |
|---|---|---|---|
| Crypto Coins Screener | A coin or token with aggregated data | Trading volume, market capitalization and circulating supply | Treating aggregated data as one exchange pair's activity |
| CEX Screener | An exchange-specific spot pair, futures or perpetual contract | Exchange, quote currency, symbol type and trading volume | Combining different instrument types without preserving their identities |
| DEX Screener | A pair within a decentralized liquidity pool | Network, exchange, liquidity and trading activity | Equating pool turnover with available liquidity |
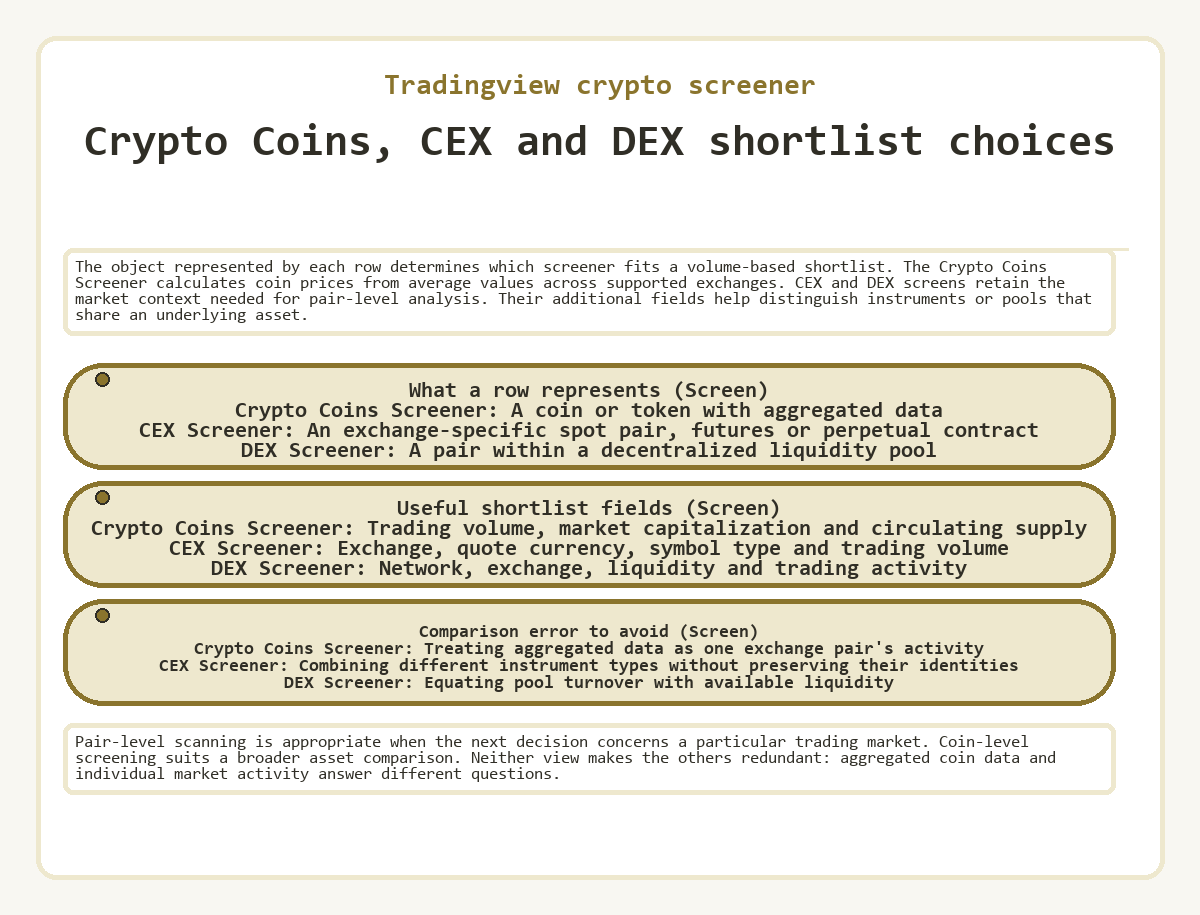
Pair-level scanning is appropriate when the next decision concerns a particular trading market. Coin-level screening suits a broader asset comparison. Neither view makes the others redundant: aggregated coin data and individual market activity answer different questions.
Saved filters and ongoing shortlist maintenance
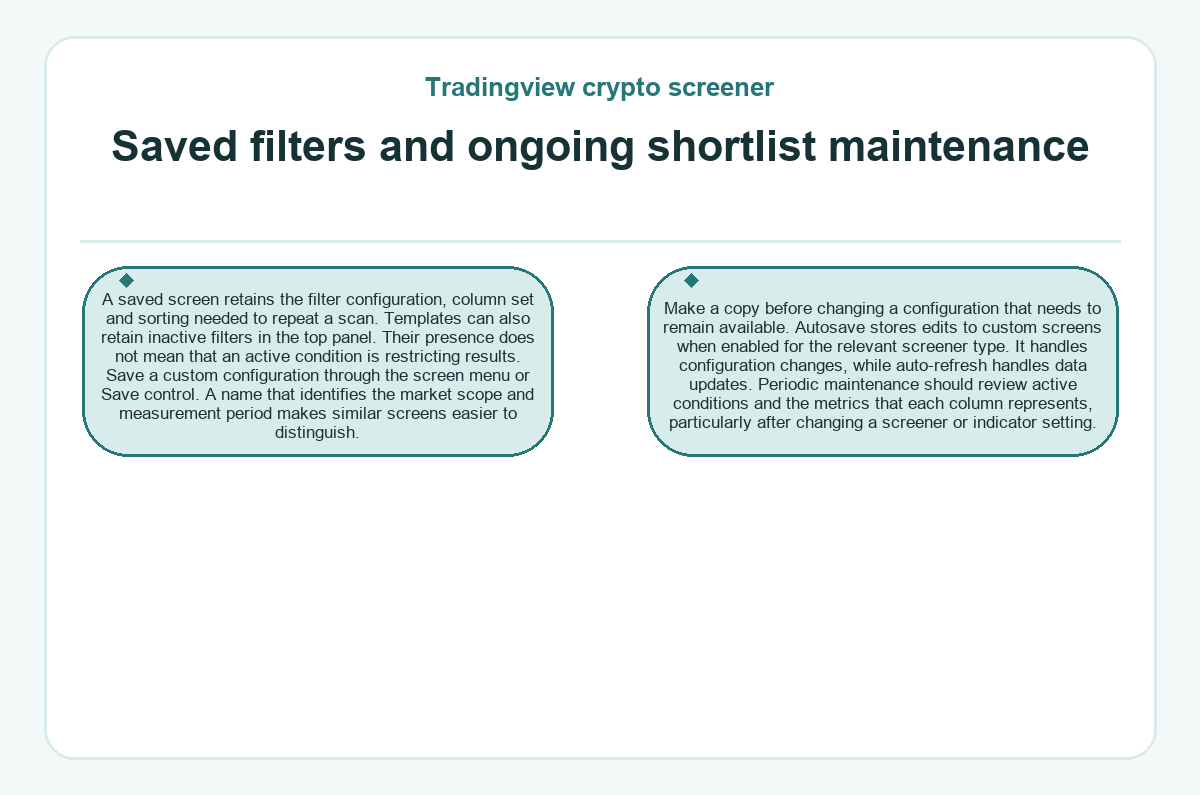
A saved screen retains the filter configuration, column set and sorting needed to repeat a scan. Templates can also retain inactive filters in the top panel. Their presence does not mean that an active condition is restricting results. Save a custom configuration through the screen menu or Save control. A name that identifies the market scope and measurement period makes similar screens easier to distinguish. Make a copy before changing a configuration that needs to remain available.
Autosave stores edits to custom screens when enabled for the relevant screener type. It handles configuration changes, while auto-refresh handles data updates. Periodic maintenance should review active conditions and the metrics that each column represents, particularly after changing a screener or indicator setting.
What should you check when a crypto scan has no matches?
Check the crypto scan's active filters and watchlist selection before concluding that a missing symbol has no supported feed.
Restrictive conditions
An empty table can mean that no available symbol satisfies the combined criteria. Loosening or removing a condition helps isolate that restriction. An active watchlist filter also limits the universe to compatible symbols from the selected list. Its contents may not belong to the chosen screener, or they may fail another active condition.
Coverage and missing symbols
A symbol available for charting is not automatically compatible with every screener type. Coverage also depends on the exchanges and markets that the selected screener supports. If a specific eligible symbol remains absent, preserve its identity, the screen configuration and the time of the discrepancy for a support request. Adjust overly restrictive shortlist criteria, or investigate missing market data if an eligible symbol remains absent.
Key questions about Tradingview crypto screener
Can I use my own Pine Script indicator to screen crypto symbols?
Custom Pine Script screening uses the separate Pine Screener. It scans a selected watchlist with an eligible indicator and supports filters based on its plots or alert conditions. The indicator must output at least one supported plot or alertcondition(). The screener supports one indicator per screen. Changes to the source, indicator settings, timeframe or filter set require a rescan.
Is a past-date crypto volume shortlist available in the screener?
The standard screener does not provide a date selector for recreating a past shortlist. Its results reflect the latest data, even when a metric measures historical price performance or a rolling volume window. Historical calculations within a field do not create an archive of former screen membership. A historical chart answers a different question from a past cross-market scan.
How can I export the volume columns from a crypto scan?
Use Export screen results in the menu opened by the screen template's name. Configure the filters and visible columns before exporting the results as a CSV file. The downloaded file preserves that export rather than updating alongside the live table. Keep a separate record of the export time and screen settings when comparing it with a later scan.
Do unique buyers in a DEX shortlist count individual people?
Unique buyers count distinct blockchain addresses that bought within the measured pool and interval. An address does not establish an individual person's identity. One person may use several addresses. Read buyer counts alongside pool trading volume and transaction counts, which measure different aspects of the activity.
Does a Strong Buy rating mean a high-volume pair will rise?
A Strong Buy rating classifies a combined technical score from moving averages and oscillators. It summarizes conditions on its selected interval; it does not predict a future price. A volume filter measures a separate property of the market, so a high-turnover shortlist can contain rising or falling pairs.
When can a shared crypto volume screen appear incomplete?
A shared screen can show incomplete data when the recipient is not signed in or lacks access to subscription-dependent fields. A watchlist filter can also appear empty if its owner has not shared the underlying list. Sharing a screen exposes its configuration; it does not give every recipient identical data permissions.
What remains in the filter bar after I reset a volume filter?
Reset clears the active filtering condition while leaving the filter in the top panel for later use. Removing the filter deletes that control from the panel. Other active conditions continue to determine the shortlist.
Are heatmaps available for CEX and DEX volume shortlists?
CEX and DEX Screeners provide only Table and Chart views, while the Crypto Coins Screener also supports Heatmap view. A chart grid helps inspect price patterns across shortlisted symbols. Table view remains useful when the decision requires exact volume figures and market identity, because visual prominence alone does not describe the pair or pool behind the data.
last updated